Mercado Libre: how much each sale really leaves
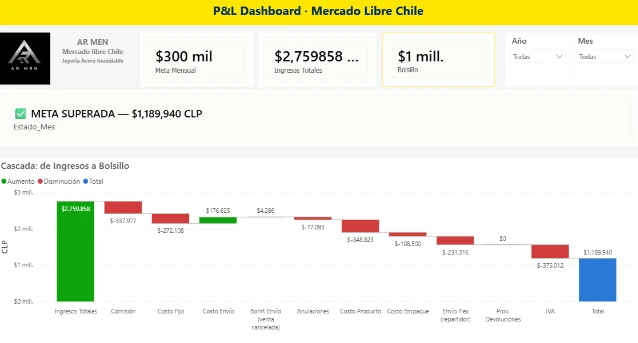
My own store on Mercado Libre, Latin America’s largest marketplace, where I sell the same accessories as in AR MEN. The Mercado Libre dashboard shows how much you sell, but not how much you keep. I built a data model to find out, sale by sale.
- Project
- Own
- Channel
- Mercado Libre Chile
- Data
- Sales since July 2025, ongoing
- Tools
- Power BI, Power Query and DAX
- My role
- Everything: the store, the data model and the analysis
Context
I came to Chile in 2022 to manage Mercado Libre for a sales company, and later I also worked with Falabella, Ripley, Paris and Linio. Today I have my own store on Mercado Libre.
Selling on a marketplace has a trap: the deposit is not the profit. Between what the buyer pays and what you really keep there are fees, fixed charges, installment charges, shipping, returns, VAT and the product cost. And each one changes with the price and the shipping method.
What I built
- A data model in Power BI that joins the Mercado Libre sales, billing and credit note reports with the cost of each product.
- The profit of each sale and each product: how much is left after all the charges, not only the fee.
- A minimum price calculator for promotions: how low a price can go without losing money. I checked it against a sale already paid and against the official Mercado Libre simulator, and it matched almost to the peso.
- Documentation of every formula and every problem found in the data.
How it is updated
It is not automatic: every month I download the Mercado Libre reports and Power BI processes them. The hard part is already solved: every peso in the report goes to the right place and the totals match the Mercado Libre dashboard.
What we learned
-
01
The “sales charge” is not only the fee
Besides the 16% fee, depending on the sale it includes a fixed charge and an extra charge when the buyer pays in installments. If you read it as the fee, the margin looks higher than it is.
-
02
The shipping that looks more expensive can leave more
For the same CLP 6,990 chain, Flex shipping left CLP 504 more per unit than mail shipping, even after paying for delivery. I checked it with real sales: 16 by Flex and 13 by mail.
-
03
Some prices change the rules
From CLP 19,990 the seller pays the full shipping cost. A product just above that price can leave less than a cheaper one.
-
04
Publishing the number even when it misses the goal
June closed at 14% of the goal and I published it on LinkedIn anyway. A dashboard that only shows the good news doesn’t help you decide. With service companies I apply the same rule: the number that matters is not the one the platform shows, but what is left.
Current status
The model is in use and I update it every month. Two costs are still missing: return logistics and storage in Mercado Full (Mercado Libre’s fulfillment service). Until they are added, the calculated margin is a little higher than the real one.